• Please use real names.

    Greetings to all who have registered to OPF and those guests taking a look around. Please use real names. Registrations with fictitious names will not be processed. REAL NAMES ONLY will be processed

    Firstname Lastname

    Register

    We are a courteous and supportive community. No need to hide behind an alia. If you have a genuine need for privacy/secrecy then let me know!
  • Welcome to the new site. Here's a thread about the update where you can post your feedback, ask questions or spot those nasty bugs!

The antialising filter "paradox"

Doug Kerr

Well-known member
We read of two seemingly-antagonistic aspects of an antialising filter:

• We must have one, else we will experience the phenomenon of aliasing in our images (notably the type that manifests as "color moiré").

• By its nature, an antialising filter degrades the resolution of the image.​
If we consider some basic principles of the theory of representation of a continuous variable by sampling, this seems paradoxical.

• We get (consequential) aliasing if there are frequencies present in our image (with any consequential amplitude) at or above the Nyquist frequency for our sensor (which is determined by its sampling pitch).

• An antialising filter averts this by having a frequency response (MTF) that rolls off to a low value by the time we reach the Nyquist frequency, thus eliminating any troublesome frequencies before the sampling is done.

• And in any case, we can't successfully capture frequencies in our image at or above the Nyquist frequency anyway.​

Thus it would seem that the antialising filter should not attenuate any frequencies we could successfully capture anyway. It should be all benefit and no harm. But we hear otherwise.

The key to this conundrum is in the three letters C-F-A - the use of a color filter array (CFA) for color imaging in most of our cameras.

Before we see how this happens, let's first practice our thoughts on the simpler case of a monochrome (B&W) sensor camera.
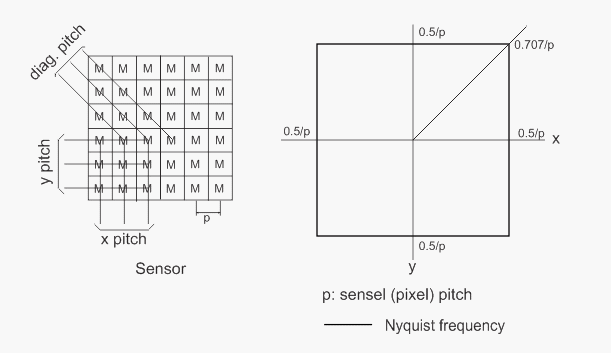
Mono_Nyquist-02.gif

Figure 1. Monochrome sensor​

The left-hand panel of figure 1 shows a section of a monochrome sensor, with photodetector (pixel) pitch p. The use of the adjacent squares suggests that the monochrome photodetectors have an intake area as large as that pitch allows ("100% fill"). That in fact is of no importance to what I will speak of here, but we might as well assume it.

We often here that the Nyquist frequency for a sampling pitch p is 0.5/p. But, unlike, for example, the sampling of an audio waveform, here we sample a 2-dimensional variable (or image). As a result, the sampling pitch, and thus the Nyquist frequency, could be different for variations in illuminance in different directions.

In the left panel we see what determines the sampling pitch in the x, y, and 45° diagonal directions. The right hand panel shows the variation in Nyquist frequency in polar coordinates: the distance to the curve, in any direction from the center, indicates the Nyquist frequency for variations in illuminance along that direction.

Note here that for the x or y directions (to which we pay the most attention), the Nyquist frequency is 0.5/p. But for a 45° diagonal direction, the Nyquist frequency is 0.707/p.

In any case, if we consider the x and y directions, to avert aliasing, we would want an antialising filter whose frequency response (MTF) has "rolled off" considerably by a frequency of 0.5/p (the Nyquist frequency). But no frequencies above that could be captured anyway, so this filter confers its benefits with no real disadvantage.

Now, we consider our infamous color filter array (CFA) sensor, using a similar figure:
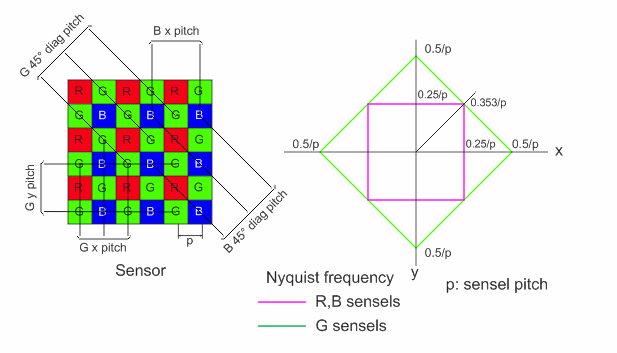
CFA_Bayer_Nyquist-02.gif

Figure 2. Color filter array (CFA) sensor (Bayer pattern)​

Here the left panel shows the Bayer pattern of R, G, and B photodetectors. Again the photodetector (sensel) pitch is p, and the figure suggests 100% fill.

We note the x, y, and 45° diagonal sampling pitches for some of the "color layers". On the right, we show the resulting Nyquist frequencies in polar coordinates, for any direction of the illuminance change.

Note that, for the x and y directions, to which we pay most attention:

• For the G layer, the Nyquist frequency is 0.5/p, just as would be suggested by the photodetector pitch (and the pixel pitch of the digital image itself).

• However, for the R and B layers, the Nyquist frequency is 0.25/p, not that suggested by the photodetector pitch, or that of the digital image itself, which would be 0.5/p. It is half that value.

Now, the punch line.

In order to avert aliasing in the R and B layers, we must use an antialiasing filter whose response (MTF) has rolled off considerably by a spatial frequency of 0.25/p.

But given that the Nyquist frequency of our digital image is 0.5/p, we hope to be able to capture spatial frequencies in the image up to almost that. The antialising filter, having "rolled off" by about half that frequency, seriously interferes with our resolution hopes.

And that's what all the palaver is about.

Best regards,

Doug
 
Last edited:

Michael Nagel

Well-known member
Doug,

you might have noticed that besides the AA filter which comes with the camera - or not - there is a third way:
Move/vibrate the sensor on a controlled way to emulate the behavior of an AA filter.

Ricoh used this concept for the Pentax K-3.

Best regards,
Michael
 

Doug Kerr

Well-known member
Hi, Michael,

you might have noticed that besides the AA filter which comes with the camera - or not - there is a third way:
Move/vibrate the sensor on a controlled way to emulate the behavior of an AA filter.

Ricoh used this concept for the Pentax K-3.
Thanks for pointing that out.

Best regards,

Doug
 

Doug Kerr

Well-known member
Why does the Bayer pattern have twice as many "G" detectors as "R" or "B"?

If we consider the CIE standard RGB model, then the luminance, Y, of a color (that is, as perceived by the human eye) is given by:

Y = 0.2126 R + 0.7152 G + 0.0722 B​

Note that the G coordinate is about 3.4 times as important in determining the luminance as is the R coordinate, and about 10 times as important as the B coordinate.

Recall that the eye is discerning of higher spatial frequencies as to the luminance of an image than as to the chromaticity (or its cousin, chrominance).
This is why, for example, we commonly, in the YCbCr representation of color actually used in JPEG encoding, resample the image at a "finer" rate for luminance than for chrominance, the so called chrominance subsampling feature.​
Since the G aspect is by far the biggest contributor in determining luminance, we get the most "bang for the buck" by sampling the G aspect at a finer rate than for the R/B aspects (as is done with the Bayer pattern). The result is that the Nyquist frequency, which serves as an absolute upper bound on the spatial frequencies than can be captured by one set of photodetectors, is half as great for the R and B aspects as for the G aspect.
In fact, in Bayer's original patent, at one stage of the description he refers to the photodetectors that we now consider the "G" set as "luminance" photodetectors.​
But to actuality exploit this, we would need to have separate antialising filter behavior for the R/B aspects and the G aspect - each ideally having a "cutoff" at the respective Nyquist frequency.

And indeed ways to make such a filter were devised. I am at the moment reviewing a patent by Eastman Kodak (application made in Europe in 1996) that does just that. But I don't know whether that technique, or others to the same end, have ever commonly been applied.

Instead, we generally use a four spot double birefringent filter. Its MTF (notably its cutoff frequency) is of course nearly identical for the three aspects. (More on that in a coming chapter of this saga.)

In choosing its parameters, we have to balance:

• the desire to prevent aliasing on the R/B aspects (which can bring color artifacts), with their lower Nyquist frequency, with

• the desire not to degrade the perceived luminance resolution of the image by imposing the same low cutoff frequency on the G aspect (which has the potential of twice the resolution owing to its higher Nyquist frequency).​

Best regards,

Doug
 

Doug Kerr

Well-known member
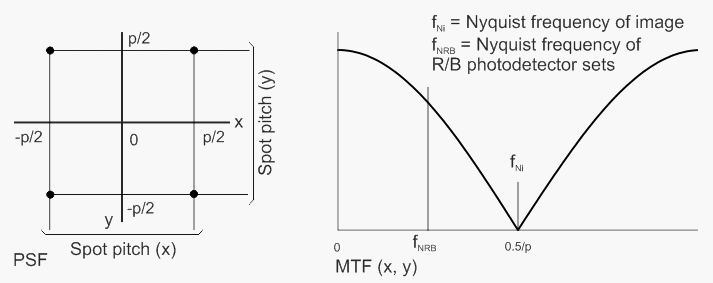
Many of our cameras use a four spot birefringent antialising filter. Basically, this takes each point of light in the image created by the lens and turns it into four spots, in a square pattern, onto the sensor. Ideally, these four spots are themselves just infinitesimal points (and the ideal theoretical frequency response of this filter I will illustrate is predicated on that).

A common "calibration" of this filter has the x and y direction spacing between the spots equal to the photodetector pitch (and thus the pixel pitch of the digital image being generated).

We see this arrangement in the left-hand panel of this figure; the spot pattern is of course the PSF (point spread function) of the filter:

AA_filter-01a.gif

Four-spot birefringent filter​

The right-hand panel shows the theoretical spatial frequency response (MTF) of this filter. Its shape in in fact an absolute cosine; that is, it is the plot of a cosine function, except that where the cosine goes negative, we flip so it will be everywhere positive (there being no meaning to a negative value of the MTF).

The response falls to zero at the Nyquist frequency of the digital image.

If we were dealing with a monochrome sensor, this is a reasonable response for an antialising filter.

But with a CFA filter, the Nyquist frequency for the R and B aspects is half the Nyquist frequency of the digital image. At that frequency, the MTF of this filter is still 0.707. So this filter would do little to prevent aliasing of the R and B aspects.

If we make the spot spacing greater, then the cutoff frequency drops, and the response could be useful in averting aliasing of the R and B photodetector sets.

But of course that response is very detrimental to the working of the G photodetector set. The result would be that the luminance resolution of the digital image would be forced below its potentially-available value given the pixel count of the digital image.

It's always something!

Best regards,

Doug
 

Doug Kerr

Well-known member
Another factor that figures into the mitigation of aliasing is sampling aperture response.

When we first study the theory of representation of a continuous phenomenon by sampling, the model is usually instantaneous, or point, sampling.

There, if we are sampling a waveform, we capture its instantaneous value at the sampling instants; if we are sampling a 2-dimensional optical image, we capture its illuminance at the sampling points. The remainder of the waveform or image is never observed!

In our digital cameras, actually following that model would be problematical. It would mean that each detector would have an "intake window" (the sampling aperture) of infinitesimal size. Not only is that hard to do, but if we did it, the amount of light energy captured by each detector would be infinitesimal - hardly what we want for a "robust", low-noise output.

So in fact we accept a finite-sized sampling aperture - in fact, we go to great extent (such as by way of microlenses) to make it as large as possible - ideally a square whose dimensions are the same as the photodetector pitch.

We sometimes hear it said that an advantage of this is that each photodetector captures "more information" about the image - after all, its takes in not just an infinitesimal point of the scene but a nice plump square region of it.

But that outlook is erroneous. We can see that two ways:

• The output of each photodetector is just a value, and a single value cannot carry "more information" than another single value.

• If all frequencies contained in the variation of illuminance over the image are below the Nyquist frequency for the sampling pitch being used, then the collection of "point" sample values tells us everything about the image - enough that from that data we could precisely reconstruct it for a viewer. There is no more information to be had.

What the finite sampling aperture does is to "blur" the sampling process (just as a finite blur figure of a lens blurs the image forming process). And, comparable to that case, the result is a decline in the frequency response of the system with increasing spatial frequency.

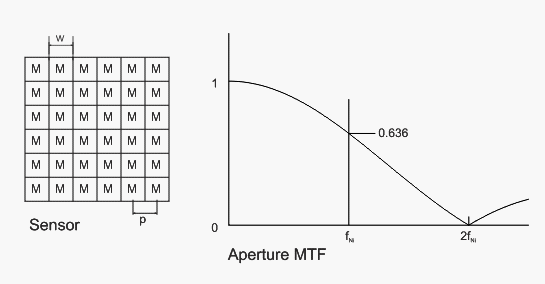
As usual, I will start by looking at a monochrome camera, using this figure:

Aperture_mono_100-01.gif

Monochrome sensor with "100% fill" sampling apertures​

In the left-hand panel, the little squares represent the sampling apertures of the individual monochrome photodetectors. The distance p is the sample pitch; w is the width (in both x and y directions) of the sampling apertures. In this example, w is the same as p. This is often called a "100% fill" situation, since the collective area of all the sampling apertures completely fills the area of the sensor.

We will in fact assume that for any sampling aperture, its "sensitivity" is uniform over its entire area (rarely mentioned, but needed for the next part to be correct).

On the right, we see the theoretical frequency response of the sampling process, as an MTF. At the Nyquist frequency of the sensor, the relative response is down to 0.636.

The shape of this curve is the infamous cardinal sine, or sinc, function, which is sin(x)/x. The scaling of x is such that its first zero occurs at twice the Nyquist frequency. (Of course, we hope that we do not actually have to deal with any frequencies at or above the Nyquist frequency, but it is interesting to note the shape of some of the function above that.)

Now, there's bad news and good news in this declining frequency response. The bad news is that of course it erodes the resolution of the digital image, although not gravely.

The good news is that this response works just the same as a filter of that response in front of the sensor. Thus this response serves to reduce frequencies that could cause aliasing. Is its shape nice for that? Hell, no. But we have it, and should perhaps be grateful for its feeble contribution to the war against aliasing.

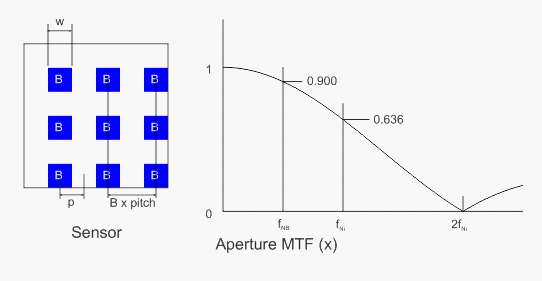
Now lets return to the ugly reality of our usual situation, with a CFA sensor. Here we examine the working of sampling aperture response for the B photodetectors (it would be just the same for the R ones).

Aperture_B-01.gif

CFA sensor - B aspect - sampling aperture response​

Here again, in the left-hand panel, p represents the photodetector pitch of the overall sensor (all three kinds of photodetectors) and the pixel pitch of the image. We note the x-direction pitch of the B photodetectors (it is the same for the y-direction), and w is the assumed width of the sampling apertures of the B photodetectors.

The Nyquist frequency for the B aspect is of course half the Nyquist frequency for the entire digital image.

In the right-hand panel we see the frequency response of the system with respect to the "B" aspect of the image. It is the same curve we saw before; the shape of the curve is only a creature of the value of w.

But note that the relative response, at the Nyquist frequency of the B aspect, has a value of 0.9.

So how does this phenomenon does as a "free" antialising filter for the B aspect? Not worth a damn.

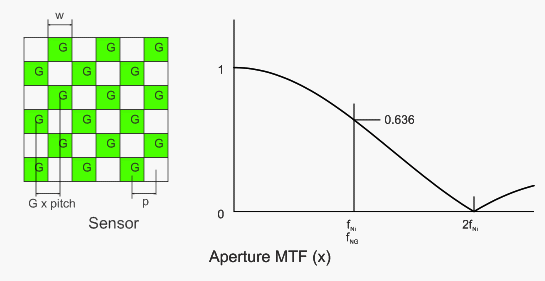
Next we do the same exercise for the G aspect:

Aperture_G-01.gif

CFA sensor - G aspect - sampling aperture response​

Recall that here, as a result of the x-direction pitch between the G photodetectors (the same as p), the Nyquist frequency is twice that for the B (or R) aspect (the same as the Nyquist frequency for the entire digital image).

At that Nyquist frequency, the relative response is down to 0.636 (just as in the monochrome sensor case).

So here, how does our "free" antialising filter do? Feeble, but better than nothing.

But it combines with the response of our real antialising filter (also of itself far from ideal) to give an overall response that will serve our purposes. Except that is is not equally appropriate for the R/B and G aspects.

Best regards,

Doug
 

Doug Kerr

Well-known member
Suppose that the sampling apertures of our sensor were wider (and higher) than the detector pitch? Well, how could we even do that. We can't actually do that in a direct way.

But in effect that can happen when we use what is called "16X microstep multishot technique", as if often done with high-performance medium format digital backs.

This technique exploits two "tricks". The first one shows up in a simpler form of the technique, called the "4X multishot technique". There, the image formed by the lens is captured by our a CFA sensor four times in rapid succession. Between each of the exposures the sensor is moved, in the x and then y direction, by the photodetector pitch. The result is that each point in the image that will become a pixel of the digital image is visited in sequence by a R photodetector, two G's, and a B.

In effect, we have created a virtual "trichromatic" sensor with photodetector pitch equal to the photodetector pitch of the real sensor (and the pixel pitch of the digital image). Thus no CFA interpolation is needed to develop the full-color digital image.

Note before we move on that the Nyquist frequency is the same for the R, G, and B "aspects" of the sampling process.

In the "16X" technique, we add a new trick. Here, we actually sample the optical image 16 times, moving the sensor in x and y increments of half the photodetector pitch. Thus four times as many points in the image as before are now visited by a R detector, two Gs, and a B. In effect, we have created a virtual true trichromatic sensor whose "pixel pitch" is half the photodetector pitch of the actual sensor. From this we get, without any need for CFA interpolation, a digital image with four times the pixel count we had with the "4X" technique (or which we would have using the sensor in the normal CFA scheme).

Thus, the Nyquist frequency of the system, for all three chromatic aspects, and for the overall digital image, is twice that of the "4X" technique.

What about the sampling aperture? Well, suppose that the sampling apertures on the actual sensor follow the "100% fill" layout: they have width and height equal to the photodetector pitch.

But that width is now twice the sampling pitch of the system.

We'll look into the implications of that in this figure:

Aperture_mono_200-02.gif

"Double-width" sampling aperture​

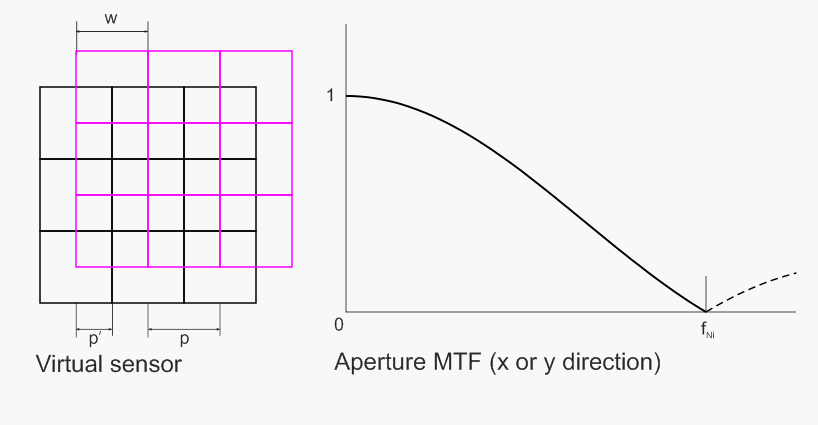
The left-hand panel represents our "virtual sensor" under 16X operation

Of course, this is tricky to draw. As a result, I only show the sampling apertures for half the photodetectors in our little area of the sensor, and I arbitrarily draw them in two colors to avoid visual confusion (had I drawn all of them, even in four different colors, the drawing would have been an impossible mess!)

Here, p is the actual physical pitch of the photodetectors, p' is the pitch of the virtual photodetectors, and w is the width (and height) of the sampling apertures (which are always "real").

Firstly, note that each of its virtual photodetectors is a full trichromatic (RGB) photodetector. And for each, the width of the sampling aperture is twice the distance between the virtual photodetectors.

In the right-hand panel, we see the theoretical system MTF. Recall that this applies equally to the R, G, and B aspects. And recall that the Nyquist frequency is the same for the R, G, and B sampling, and is the same as for the digital image.

And we see that the system frequency response drops to zero at this Nyquist frequency.

So here, does this response make a "pretty nice" "free" antialising filter? Well, much better than we saw before.

And, as a result, I understand that it is rare to have an actual antialising filter on the sensors used in this technique.

But if we wanted to put one there, it could be optimized for all three aspects of the sampling: R, G, and B, and thus would not necessarily compromise resolution significantly compared to what we are limited to anyway by the Nyquist frequency.

Best regards,

Doug
 

Doug Kerr

Well-known member
Hi, Arthur,

Hi Doug,

The linked images are broken with a 404 error, you might want to refresh the locations to wherever you have them now.

I believe those images were deleted by me in response to a bad reaction to my article. (We were in the middle of a bad wave of 'anti-scientism" at the time.)

Maybe I can find them and restore them.

Thanks.

Best regards,

Doug
 

Doug Kerr

Well-known member
Hi, Arthur,

No, I think those files were somehow knocked off the server (not sure how).

I put them back, and the original posts in the series should work now (be sure to refresh your browser if they don't show up at first).

Thanks again for the heads up.

Best regards,

Doug
 

Arthur Haselden

New member
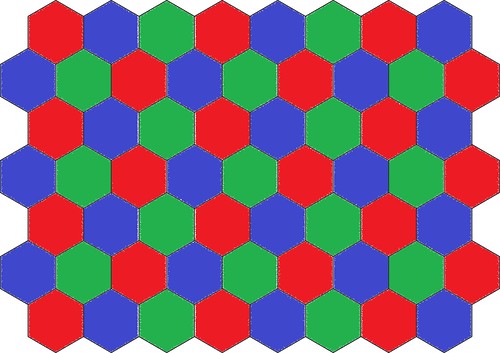
I have to ask why RGB photography sensors are not made in a hexagon with the following RGB pattern? It would make better use of the lens output allowing more options for cropping without rotating the camera.

12072914644_3f33f4faa7.jpg


This would improve nyquist for real objects unless you do mostly architectural shots. The 3 primaries are also closer together giving better color rendition.
 
Hi Arthur,
the idea to use a hexagonal lattice is a very good one - at least I had the same idea.
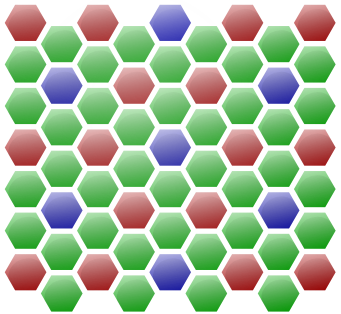
The problem with your CFA is just that none of the three primaries can capture high frequency information. I did some simulation for that and the results were pretty disappointing. I would rather suggest the following CFA
HexagonalColorFilterArray.png

This is able to capture high frequency information from the green channel and use that to help interpolate red and blue. Check out some test images here: http://goo.gl/le86w0
 

Asher Kelman

OPF Owner/Editor-in-Chief
Hi Arthur,
the idea to use a hexagonal lattice is a very good one - at least I had the same idea.
The problem with your CFA is just that none of the three primaries can capture high frequency information. I did some simulation for that and the results were pretty disappointing. I would rather suggest the following CFA
HexagonalColorFilterArray.png

This is able to capture high frequency information from the green channel and use that to help interpolate red and blue. Check out some test images here: http://goo.gl/le86w0

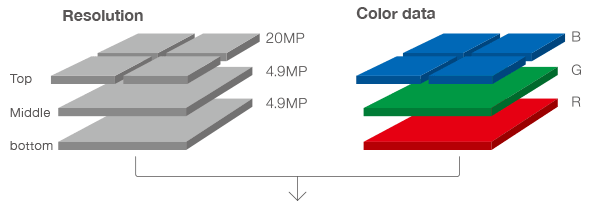
This reminds me of the new weight on blue in the stacked Foveon senseless in the new Sigma fixed focal length cameras.

highres-quattro_solution_image_1392026221.jpg

Asher
 
Top