• Please use real names.

    Greetings to all who have registered to OPF and those guests taking a look around. Please use real names. Registrations with fictitious names will not be processed. REAL NAMES ONLY will be processed

    Firstname Lastname

    Register

    We are a courteous and supportive community. No need to hide behind an alia. If you have a genuine need for privacy/secrecy then let me know!
  • Welcome to the new site. Here's a thread about the update where you can post your feedback, ask questions or spot those nasty bugs!

Off-setting a Light Meter

Dear community,


The study I would like to present here constitutes an original piece of work, devised and carried out by yours truly, as an attempt to answer certain questions related to the foundation of operation of hand held light (flash) meters.

This work is purely technical, involving some mathematical approach, just to be able to introduce and analyze the theoretical model adopted and to check if this model’s foreseen results are verified in reality, by taking actual measurements with a camera and a series of different lenses.

This work is definitely not to be perceived and not aimed as a “How to Use” a light (flash in this case) meter technical manual or a Tutorial on light meter handling, but it can be used, I believe, as a guide for testing out different lenses regarding their influence to the exposure determination. But certainly, it is not my aim to suggest that everybody should test every lens he or she can lay hands on, in order to be “accurate” in light metering, since “light metering is a serious and extremely complicated process, meant only for serious photographers” – NO! – I simply make an attempt to find out what are light meters specifically designed to do and why.


Dear Doug, as you are the Moderator here, please let me know if this is the right place for this study to be presented, or it is better to be somewhere else or nowhere at all, if this work does not interest this community!


The questions I am asking in specific are the following:


- Why do I usually get different readings between reflected and incident (dome open) light measurements, taken for the same 18% reference reflectance Neutral Grey Test Card (18% NGTC)?

- What kind or reference reflectance (11.55%, 12%, 12.5%, 12.7%, 15.7%, 18%, other?) is implied for the calibration of a Reflective Light (flash in this case) meter?


- In practice, what kind of offsetting would a lens introduce to a light meter measurement?


Before torturing the reader with the basis, argumentation and analysis of these points, let me outline my findings right away:


- A Light (Flash) Meter at Incident - dome open (‘lumisphere”) measuring mode is designed to better fit with the lighting conditions of a 3-D subject. When this mode is used for a 2-D subject like a 18% NGTC surface it is normal to generally suggest different readings from a reflected light measurement of the same 18%NGTC.


- Light (Flash) Meters in reflective metering mode as well as in incident - dome retracted (“lumidisk”) mode, are in line with the concept of 18% tonality reference, as expressed in the raw image color histogram of a spike at the center of it.

- If an offset is to be introduced so as to account for the influence of a particular camera – lens system used to the meter reading, this is to better to be done with reference to reflective and or incident – mode retracted (“lumidisk”) measuring modes – not to the incident – dome open (“lumisphere”) mode. Typical offsets are ranging within of 0.3 stop.


In the next part I shall proceed with the analysis to support what is just stated.
 
Part 2


The idea of introducing an offset to a light meter, or a flash meter as in the case here, is not new and stems mainly from the following facts:


First is that a hand held meter’s calibration settings of ISO values do not necessarily coincide with the camera sensor ISO settings implementation (DxO has a lot to say on this), while the suggested by the hand held meter f-stop may not take into account any “typical” light losses (~ 0.15EV – T/stop concept) as the light is passing through the glass elements of the lens, and this “loss” can vary from lens to lens. Moreover, a claimed by a manufacturer f/1.4 lens, may not be effectively a 1.4, or even some f-stops may not be implemented accurately.
Finally, the registered image’s tonality also depends on the specific digital image processing algorithms and parameter setting applied by the camera and software.

Second is the commonly known as *secret fact* that light meters do not use the 18% Neutral Grey tonality any more as a definite reference for calibration of incident vs. reflected reading and consequently, these readings of incident/reflected of the same 18% grey target generally do not match.


The aim is to analyze, according to a certain criterion, the behavior of our camera-lens system in rendering an image of an 18% Neutral Grey Test Card (NGTC), so as to introduce –if needed- certain offset values in order to accomplish our criterion.


The criterion adopted here is the RAW image histogram form of the 18% NGTC true tone (diffuse reflection components only, no glare). This form should resemble a spike around the center area (127-128 as it is commonly accepted for the correct medium-18% grey-tone registration in digital photography.


I intentionally use the word “off-setting” instead of “calibrating” since what we try is to relate the meter readings with a particular camera-lens combination, rather than to re-calibrate the meter to different standards, a process which would require strict, certified laboratory testing, according to a standardized process.

For a particular camera – lens combination we expect to determine offsets, which would - ideally - be uniform for the complete range of f-stops used on the same lens.


There have been debates about light meter operation and measurement technique, also highlighting the so-called “irregularity” of non-equal readings when measuring incident light on a 18% NGTC versus reflecting reading off the same card, in the same lighting conditions.

To analyze this, we can use a simple theoretical model in order to arrive at a theoretically expected reflected/incident discrepancy for a particular manufacturer (Sekonic).


For this purpose, if we call Vinc, Vrefl the meter reading values for incident and reflected light respectively, the metering equations can be expressed as:


Vinc = fn^2 / (T * ISO) = E / C

Vrefl = fn^2 / (T * ISO) = L / K​


Values fn: the f-number and T: time (sec) are the proposed ones by the meter for a particular numerical ISO value (100, 200, 400, etc., i.e. a mathematical value).


The quantity E represents the true illuminance of the scene, i.e. the luminous flux or light power falling on the meter receptor and equally on the surface of a Test Card, while L is the scene’s luminance, i.e. the apparent brightness of the Test Card assumed.


The parameters C and K represent the calibration constants for incident and reflective measurements accordingly, varying according to manufacturer.


Applied for Sekonic light meters, these are chosen to be (according to Sekonic):


C_disk = 250 with the translucent dome retracted (lumidisk position), with the E expressed in lux.

C_sphere = 340 assuming on axis illumination of the open translucent dome by a point source, with illuminance E expressed in lux.

K = 12.5 for the reflected light meter, with luminance L expressed in cd/(m^2 sr)


We can express the true tone, i.e. the diffused (Lambertian) reflectance of a Test Card as:


R = (total luminous flux diffused from card surface) / (total luminous flux incident on card surface)​


It can be proven that R –the Lambertian component of reflectance- is given by the equation:


R = π * L / E​

Obviously, we can seek a particular reflectance R* for which the incident and reflective readings of the Test Card match (equal readings), Vinc = Vrefl, we get:


L / K = E/ C or L / E = K / C​

Therefore

R* = π * K / C​

Substituting for constants K, C_disk and C_sphere we get:


R*_disk = π * 12.5 / 250 = 15.7%

R*_sphere = π * 12.5 / 340 = 11.55%​


Therefore, when measuring a test card of arbitrary reflectance R we get:


Vrefl / Vinc_disk = R / R*_disk, or for R = 18%NGTC:
Vrefl / Vinc_disk = 18/15.7 = 1.146 = +0.20-stop


Vrefl / Vinc_sphere = R / R*_sphere, or for R = 18%NGTC:
Vrefl / Vinc_sphere = 18/11.55 = 1.558 = +0.64-stop


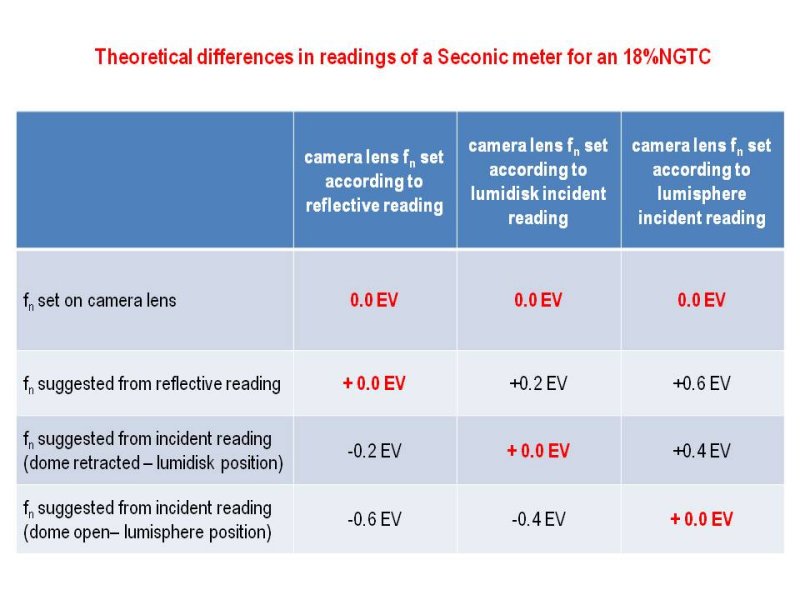
Based on the last relations it is evident that for Sekonic meters, the reflective reading off an 18% NGTC true tone is expected ALWAYS to suggest a higher exposure value than the corresponding incident reading (2/10 EV greater than the lumidisk reading and 6/10 EV greater than the lumisphere reading). Moreover, independently of course of the subject’s reflectance, the lumidisk incident is expected ALWAYS to suggest a higher exposure value, 4/10 EV greater than the corresponding lumisphere incident reading.

It is important to note that the above theoretical figures are approximated assuming a particular setup, a single point light source in a dark-walled room, lighting the 18% card perpendicularly, taking incident measurements on axis and reflective measurements at oblique angles from card’s surface.


In the next part, I shall outline the method adopted and the actual measurements performed
 
Part 3


Measurement Method

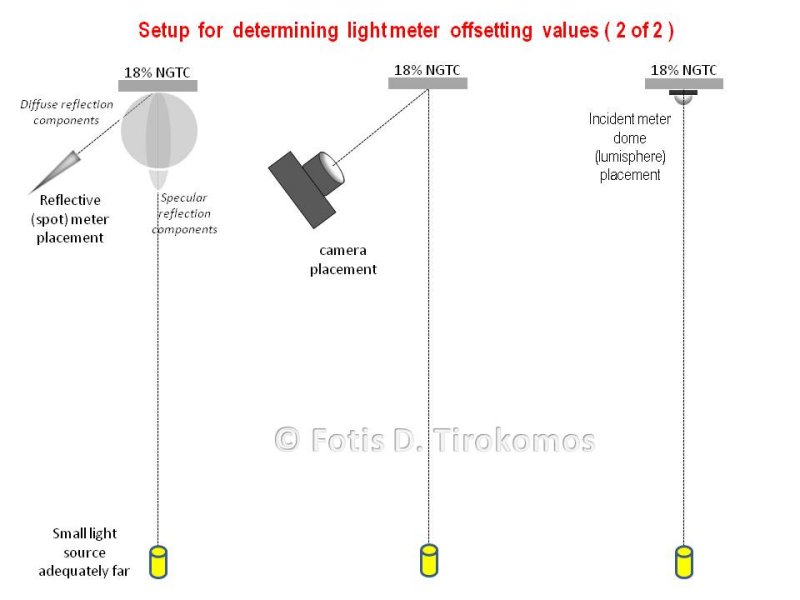
The proposed method comprises the use of a small light source with a snoot, placed adequately far away from an18%NGTC in subject, to light it evenly, avoiding as much light as possible coming from adjacent walls. The card is oriented facing the light source directly.


The schematic diagrams below depict this setup.


large.jpg


large.jpg


The incident light meter, dome retracted (“lumidisk” mode) or dome open (“lumisphere” mode), is placed with its axis perpendicular to the test card, thus directly facing the light source as well, whereas the camera and the reflective spot meter should be placed at an angle, clearly away from the specular elements – glare - reflected by the test card.


The reasoning behind this arrangement is presented in the diagrams' description.


To assess the criterion of this measurement, i.e. the histogram of the actual image registered in the raw file of the18%NGTC we must choose the color space of use, (sRGB selected) and we should adjust the white balance beforehand, shooting the card by the particular light source, through the particular lens. The color histogram can also be observed on camera, for neutral (unbiased) settings of the parameters (contrast, brightness, saturation, hue).


The histogram of the 18%NGTC image is expected to present a spike at the center when no offset is to be introduced


The problem is though that according to the previous analysis which leads to the table below, if a histogram is rendered accurately for one meter reading (reflective, lumidisk incident, or lumisphere incident), it will not be centered for the other two readings.


large.jpg


I would prefer to determine the offset for the reflective reading and secondary to define the corresponding offset for lumidisk reading, since this exact mode better fits for measuring 2-dimentional things, as is the case of the grey card in subject. In theory, since the particular meter I use permits independent offsetting for reflective and incident, if I correct accordingly and independently for lumidisk as well, I would then allow for the incident dome mode to overexpose the 18% card by 0.4 stop.


Actual Measurements


Camera used: Nikon D3,
Color Space selected: sRGB,
Picture control set: neutral
ISO number set: 200 (both on camera and light meter)

Lenses used:
-Nikon Nikkor 24 – 70mm 1:2.8 @ 70mm
-Nikon Nikkor 85mm 1:1.4 D
-Nikon Nikkor 105mm 1:2 D
-Nikon Nikkor 135mm 1:2 D
-Nikon Nikkor 70-200mm 1:2.8 G AFS VR @ 105mm

Light (flash) meter used: Sekonic L-758D

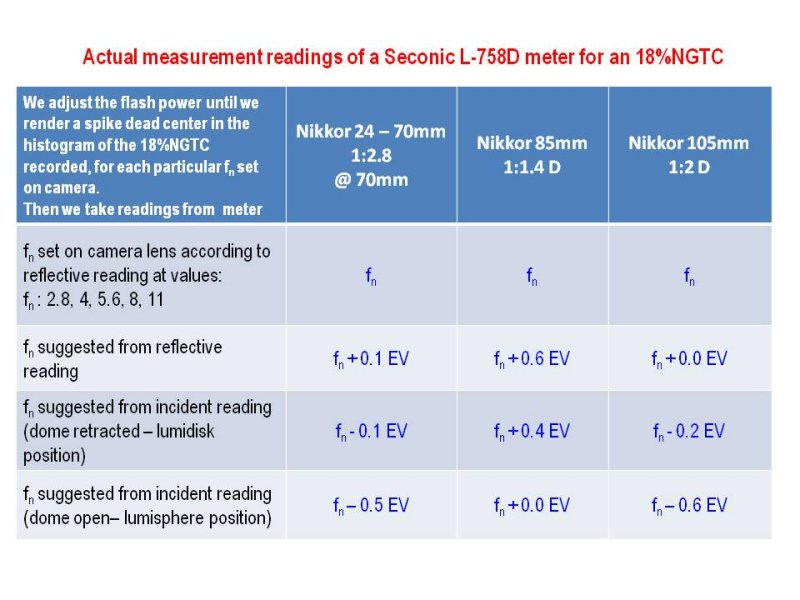
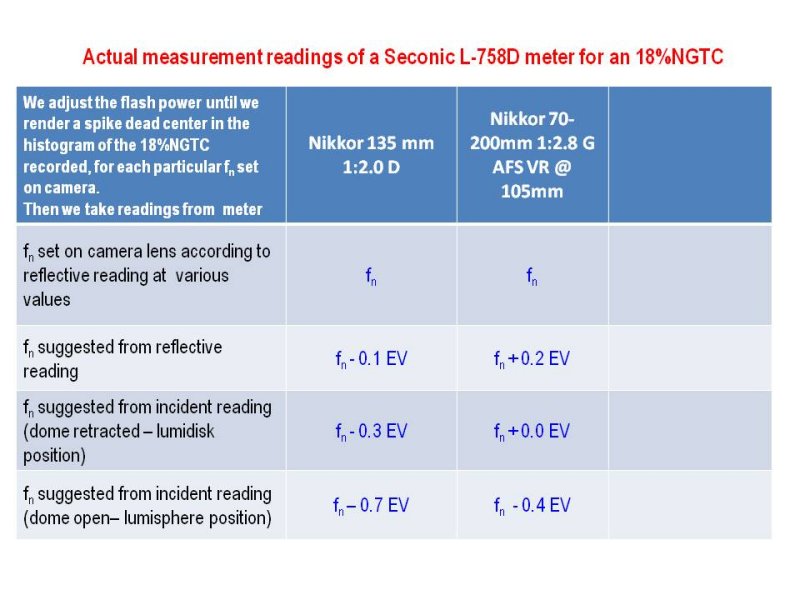
Actual measurements are presented in the tables below.
The measurements were repeated and have been reproducible within 1/3 of a stop, meaning that if x1, x2, x3 were the offsets I arrived at from rounds 1, 2, 3, the difference max – min of x was within 1/3 stop.

It’s worth noting though that, in EVERY round of measurements for the same lens at the same f-stop, the difference between reflective vs. incident – lumidisk and the difference between reflective vs. incident – lumisphere ALWAYS was consistent, i.e. 0.1-0.2EV (0.2 theoretically) and 0.5-0.6EV (0.6 theoretically) respectively.


large.jpg


large.jpg


My interpretation of the above is that the theoretical model and the setup used is valid, since the results it foresees are verified in practice.

One important conclusion from the measurements is that:

Modern Light Meters (with emphasis to Sekonic) are NOT designed to provide equal readings reflective vs. incident – dome open (lumisphere) when measuring an 18% Neutral Grey Test Card. We must be aware of this and also know that each camera/ISO and lens system may affect the resulting exposure differently.


Out of the above results, the deviation of reflective (spot) metering from the f-number set on camera, after we have adjusted the flash power to achieve an histogram with a centered spike, remains pretty consistent for four out of the five lenses, ranging from -0.1 to +0.2 EV.


I am therefore convinced that the handheld reflective meters are indeed calibrated very close to Medium Grey (with K=12.5 for Sekonic or K=14 for Kenko which implies a 0.16 stop difference in readings, who’s more accurate? – I don’t know and I don’t care!).


To restate it more vividly, I strongly believe that reflective light meters are in accordance with the good old and familiar 18% Medium Grey reference and concept.


Any “perceived” deviation from 18% medium grey is due to the introduction of the system camera – lens in the measurements and this is mainly because camera’s ISO may not be accurate and the lenses used may vary because of different transmission losses or f-stop implementation inaccuracies.


There is a simple way to check this:

Choose a plain, uniform surface such as a light painted matte wall.

Light it uniformly and perform a white balance calibration. Take a reflective reading from camera’s view position after adjusting the light power to render a middle f-stop reading, something like 5.6 or so.

Take a shot and examine the histogram. All reflected light meters are measuring whatever scene so as to represent it as the medium tone they are calibrated at, so if this is the 18% tone, the histogram should render a spike close enough to the center. This simple test should be of course taken with a variety of lenses to be able to the difference influence each lens introduces.


What about the statements that “Meters Don't See 18% Gray , suggesting that photographic light meters are calibrated for 12% , or other than 18% average reflectance” ?


I believe that this is a misinterpretation of the fact that reflective vs. incident (dome open – lumisphere) readings of an 18% test card differ by design, i.e. the selection of constants K and C_sphere, give a difference of 0.6 stop (Sekonic) between them.

If one takes for granted that the incident reading (dome open – lumisphere) is the correct one then the reflective reading suggests a higher value of ~0.6stop rendering the tone of 18% grey as darker than medium, therefore the misinterpretation.

But, I believe, it is exactly the inverse: If the reflective reading of the 18% test card is correct, then the incident (dome open – lumisphere) reading is expected to suggest a lower exposure value ~0.6 stop, rendering the 18% grey tone as lighter than medium, thus overexposing it.


But then, is the incident meter wrongly calibrated?

The answer is NO. – At least, not necessarily!

It is as simple as this: the incident meter dome open – lumisphere mode, is NOT designed to measure a grey card accurately. Its purpose is to average out the illuminance falling on a three dimensional subject, replicating this by its translucent sphere, providing what is claimed as, the best possible exposure for such a complicated case as a 3-D subject is.

As a result “lumisphere” measurements are strongly lighting setup dependent and in order to see this, consider the following: For various lighting conditions check out how the two modes of incident readings (dome open, dome retracted) behave in relation to each other:

- For a single, small light source as in the setup utilized here, the “lumidisk” reading is always greater than “lumisphere” reading.
- For a big light source such as a softbox standing nearby, the lumidisk” reading is always smaller than “lumisphere” reading.

Since this relation varies, in which exact circumstances using e.g., a large softbox setup would be bound to render correct readings in “lumisphere” mode for the exposure of a 18% card? (Note that the characterization C_sphere = 340 (Sekonic) is valid only for the setup described above).


What about the dome retracted – “lumidisk” mode reading, what does it represent and is it to be trusted for a potential offsetting determination?

This mode deems to represent a close approximation of the true Illumination falling on the receptor itself (Illumination as a physical quantity, i.e., luminous flux per unit area) and therefore is definitely to be trusted, especially when measuring a flat – 2 dimensional surface, as recommended by the manuals as well.

For an 18% NGTC the “lumidisk” placed directly flat on the surface, will provide the correct settings for representing the true tone of the 18% card (well within 0.2stop, as this difference is stipulated by Sekonic, I don’t know where it comes from. By the way, for Kenko light meters this difference is almost 0, Kenko takes K=14/ C_disk=250, so who is more accurate Sekonic or Kenko? – The differences are minute, so I don’t care!).


Dear reader,

I am very sorry for putting you through this torture and if I managed to keep you this far, thank you for your patience!

The only reason I presented this lengthy analysis is to support my arguments, nothing else, I don’t try to teach anybody here and I wish I could find a simpler way to present this analysis.

I would like very much to receive your comments, thoughts and experience on the points a make in this study and start a constructive discussion.


Kindest Regards,


Fotis D. Tirokomos
 
Last edited:

Asher Kelman

OPF Owner/Editor-in-Chief
Kalimera , Fotis!

To insert diagrams or pictures ending with .jpg or .png simply get the URL of the image and then place it between


You can send me an image to editor.opfATmac.com replace at with @

I can place these ones for you.

Still, you need to sign up for a free account at http://Photobucket.com, http://picasa.com, or http://flickr.com to get a free account and host your pictures!

Asher
 
Kalimera , Fotis!

To insert diagrams or pictures ending with .jpg or .png simply get the URL of the image and then place it between


You can send me an image to editor.opfATmac.com replace at with @

I can place these ones for you.

Still, you need to sign up for a free account at http://Photobucket.com, http://picasa.com or http://flickr.com to get a free account and host your pictures!

Asher

Thank you Asher, I will try! - edit - tried - done!
 

Doug Kerr

Well-known member
Hi, Fotis,

Firstly, welcome aboard.

Dear Doug, as you are the Moderator here, please let me know if this is the right place for this study to be presented, or it is better to be somewhere else or nowhere at all, if this work does not interest this community!
If you mean me, no, I am not the moderator here - just a contributor.

But this seems an excellent place to present this material .

The topic of your monograph is of great interest to me (on numerous fronts), and I will be fascinated to read it. Just now, I am up to my neck in other stuff (a real hazard of being "retired"), so it might be a few hours before I can actually attend to it.

In the meantime, thanks so much for this important contribution to an area about which there is so much misunderstanding. (You may have read some of my monographs about the holy number, "18%".)

Best regards,

Doug
 

Tom dinning

Registrant*
I knew that, didn't I?
I know there is an application for all this but I just can't put my finger on it.

Thanks for sharing, Fotis. I think!
 
Histogram Center Reflectance and True ISO Speed


In a neighboring thread conducted by Doug Kerr about "The fundamental premise of "single-valued" expsure metering"

http://www.openphotographyforums.com/forums/showthread.php?t=16100

I commented about the fact that many manufacturers of DSLRs 35mm are consintently underexposing by 1/3 stop, from the set on camera ISO speed, meaning that a set ISO 200 is in reality a True ISO speed of 160, etc for a significant range (200 - 3200 at least).

The above can be seen at the DxO Labs site:

http://www.dxomark.com/index.php/Cameras/Camera-Sensor-Database/Nikon/D3

at "Measurements".


Thinking about this systematic occurence, I thought about checking how my camera’s sensor registers each tonality from pure white down at least medium (center) tonality on the resulting histogram. The histogram a took is of the TIFF file as converted from RAW, using CNX2, observed by VNX2.


I set the ISO speed on camera (Nikon D3) at the (nominal) value of ISO 200, chose an aperture (f/13) and adjusted the light power on a blank wall carefully until I got almost pure white (252-253), just before clipping, on the TIFF histogram.

Then I carefully went down in steps of -1 stops, by adjusting the light (strobe) power, always controlling this accuracy with my flash meter.

I found out that at exactly 3 stops under white clipping point I got a registered grey tonality at the center of the histogram (128 - 132).


The same results occured when I repeated this process at set ISO speeds 800 and 3200.


The conclusion I can derive from the above tests is that my camera consistenly registers the 12.5% reflectance of grey at the center of the histogram, as -3 = log2 ( 12.5% / 100% ).


This result showed me at least that my original assumption that a 18% reflectance is "mapped" at position 127 - 128 of the histogram was incorrect.


I am not in position to say that this fact is true for all sensors' images no matter what software is used to render and examine the image histogram, but never-the-less such a coincidence?


On the other hand, if this chain of algorithms is tuned and as a result the histogram center always corresponds to 12.5% of reflectance, then this is fully in line with the fact of "ISO speed underexposure":


A properly exposed, by an external reflective light meter, 18% grey card, which consists the medium tone in the analog domain, will be registered as a spike at the center of the RGB histogram scale, where the 12.5% reflectance is mapped, - the medium grey of the digital domain, after losing 1/2 stop (i.e., the difference between 18% and 12.5%), due to the true ISO speed underexposure (~1/3stop) and the lens transmittance loss (~1/6 stop - typical).


Or this is just a coincidence and there is no actual correspondence between reflectance and its registration on the histogram scale
 
Top