
Doug Kerr
Well-known member
I suggest that the reader first read this article:
http://www.openphotographyforums.com/forums/showthread.php?t=21462
The well-respected testing organization DxOMark publishes thorough reports on the behavior of the sensors in many cameras. One interesting section of these reports is the Color Response section. Here we see a sample of that section, this one for the sensor of the Canon EOS 20D:
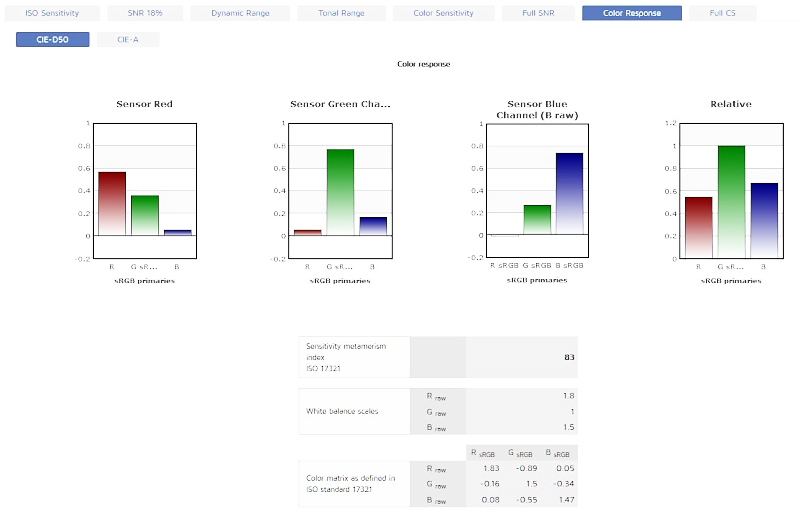
I first call attention to the leftmost three bar charts at the top. What do they tell us?
Let me step back from this report for a moment and review some matters relating to sensor response. First let us consider the kind of sensor I described (as item b) in my earlier article as desirable (but not attainable): one in which the sensor output values would be consistent for light of any given color, regardless of the spectrum that gives it that color. Such a sensor is spoken of as a "colorimetric" sensor, meaning literally that it "measures color".
We will assume that it delivers its "color" report in terms of three coordinates, not necessarily those of any color space we use for image interchange. It can be shown that we can convert its three output values to the three coordinates of some recognized color space (such as the coordinates r, g, and b, which are the underlying coordinates of the sRGB color space, not yet made non-linear) with a (fixed) linear transform. This can be executed by multiplying the sensor output values by a (fixed) matrix, which defines the transform.
But how can we determine the proper matrix? In a laboratory, we expose the sensor to a fixed level of light whose color is sequentially that of the three sRGB primaries. We record, for each primary, the outputs of the three sensor channels. We arrange those nine results as a 3×3 matrix and take its inverse. The resulting matrix is the one we should use (in the actual camera) to convert the sensor outputs to r, g, and b, from which we can proceed with the image processing.
Very tidy.
[To be continued]
http://www.openphotographyforums.com/forums/showthread.php?t=21462
The well-respected testing organization DxOMark publishes thorough reports on the behavior of the sensors in many cameras. One interesting section of these reports is the Color Response section. Here we see a sample of that section, this one for the sensor of the Canon EOS 20D:
I first call attention to the leftmost three bar charts at the top. What do they tell us?
Let me step back from this report for a moment and review some matters relating to sensor response. First let us consider the kind of sensor I described (as item b) in my earlier article as desirable (but not attainable): one in which the sensor output values would be consistent for light of any given color, regardless of the spectrum that gives it that color. Such a sensor is spoken of as a "colorimetric" sensor, meaning literally that it "measures color".
We will assume that it delivers its "color" report in terms of three coordinates, not necessarily those of any color space we use for image interchange. It can be shown that we can convert its three output values to the three coordinates of some recognized color space (such as the coordinates r, g, and b, which are the underlying coordinates of the sRGB color space, not yet made non-linear) with a (fixed) linear transform. This can be executed by multiplying the sensor output values by a (fixed) matrix, which defines the transform.
But how can we determine the proper matrix? In a laboratory, we expose the sensor to a fixed level of light whose color is sequentially that of the three sRGB primaries. We record, for each primary, the outputs of the three sensor channels. We arrange those nine results as a 3×3 matrix and take its inverse. The resulting matrix is the one we should use (in the actual camera) to convert the sensor outputs to r, g, and b, from which we can proceed with the image processing.
Very tidy.
[To be continued]